Video Ad Creative Testing at Scale: Cost Per Winning Ad, Hidden Costs of Under-Testing, and 2026 Framework for Media Buyers
Video ad creative testing at scale in 2026: cost per winning ad by budget, hidden costs of under-testing (5 ads vs 50 vs 300), and the testing framework media buyers, agency owners, and CMOs use to ship 50–300+ creatives per campaign across coaches, agencies, and service businesses (HVAC, roofing, mortgage, real estate).

Targeting is a tax. Creative is the business — and creative testing at scale is where cost per winning ad gets won or lost. The hidden cost of under-testing video ads is the one nobody itemizes: every campaign that ships with five creatives instead of fifty is paying for it in inflated CPL, fatigued impressions, and budget waste that gets quietly absorbed into "the algorithm got worse this month."
Every major platform shift of the last five years — broad audiences, Advantage+, Performance Max, Smart campaigns — points the same way: the algorithm is taking over targeting decisions, and your job as a media buyer, agency owner, or CMO is shrinking to one lever. That lever is creative. A 2024 Nielsen study found creative quality accounts for 47% of ad-driven sales lift, outpacing reach (22%), targeting (9%), and brand recall (15%) combined. And yet most businesses — from D2C coaches to HVAC contractors, mortgage brokers, roofers, and real estate teams — test fewer than five video ads at a time, discover the obvious, and spend the next quarter wondering why their cost per lead keeps climbing.
This is the buyer's guide to video ad creative testing at scale in 2026: how many ads you need at each budget level, the real cost per winning ad after testing, the hidden costs that show up when you under-test, the framework for shipping 50–300+ creatives per campaign, and the week-by-week optimization workflow that protects your CPL through every fatigue cycle.
TL;DR
- Creative half-life is 7 days on Meta and TikTok for cold traffic campaigns — your ads stop working faster than you think
- 50+ creatives per campaign is the minimum for proper signal; 300+ is where elite advertisers operate
- 3–5x ROAS improvement is achievable when moving from 5 creatives to 50+ with systematic testing
- $5–$50 per test creative with batch video production versus $500–$5,000 with traditional agency production
- Advertisers who rotate fresh creative weekly see CPL drop 30–60% versus static campaigns in the same market
- Most platforms need 50 optimization events per ad set per week before the algorithm can exit the learning phase — running 3 ads at $1,500/month means most of your spend never exits learning
Key Takeaways
- Volume beats perfection. A library of 50 decent ads consistently outperforms 5 polished, expensive ones. The algorithm needs data diversity to find your buyers.
- The 7-day rule is real. Meta's internal data shows average creative frequency-to-fatigue happens in 5–9 days for cold audiences at moderate spend levels. Plan your creative pipeline accordingly.
- Testing without a framework is guessing. Unstructured "let's try a few things" testing wastes budget and produces conclusions that don't generalize. Use champion-challenger methodology.
- Platform rules differ. Meta rewards hook diversity. TikTok rewards native authenticity. YouTube rewards long-form value. Test the same creative across platforms and you'll leave performance on the table.
- The hidden cost of under-testing isn't just mediocre results — it's the months of budget you spend at inflated CPL before you discover what actually works.
- Creative testing is permanent infrastructure. The best advertisers in every vertical treat creative production as ongoing operating cost, not a one-time project.
Why Creative Testing Matters More Than Ever in 2026
The Algorithm Took Over Targeting — And That's Good News
Ten years ago, targeting was the moat. The advertiser who built the best custom audiences and lookalikes had an inherent edge that was hard to replicate. That moat is gone.
Meta's Advantage+ audience tool now routinely outperforms manually built custom audiences for cold traffic. Google's Performance Max removes nearly all placement and audience controls. TikTok's algorithm self-selects buyers with eerie accuracy from broad targeting parameters.
What the algorithm cannot do for you is produce the creative itself. It can only optimize among the options you give it. Give it five mediocre choices and it will find the best of five mediocre options. Give it 300 strategically varied options and it will find the one angle that makes your specific buyer stop scrolling.
Creative is now the only durable competitive advantage in paid social.
Ad Fatigue Is Accelerating — The Data
The fatigue curve has steepened dramatically since 2020. Here's what's driving it:
- Attention compression: Short-form video platforms trained audiences to make engagement decisions in under 1.5 seconds. The cognitive threshold for "I've seen this" dropped in parallel.
- Competitive density: Average ad load on Meta feeds increased 34% between 2022 and 2025. Your audience is seeing more ads, from more advertisers, more often.
- Algorithmic acceleration: Automated bidding systems push impressions to high-frequency users faster than manual campaigns ever did. Your "best audience" gets your ad more often than they used to.
- Recall without action: The more times someone sees an ad without clicking, the stronger the negative association. Overfrequency doesn't just stop working — it creates active resistance to your brand.
The Frequency-Performance Cliff
Meta's own data shows a consistent pattern across campaign types:
| Frequency Level | Average CTR Drop | Average CPL Increase |
|---|---|---|
| 1.0–2.0 | Baseline | Baseline |
| 2.0–3.0 | −12% | +18% |
| 3.0–4.0 | −28% | +41% |
| 4.0–5.0 | −52% | +89% |
| 5.0+ | −71% | +167% |
The math is simple: if you're running 5 ads and frequency hits 4.0 before you've generated enough leads, your campaign effectively doubles in cost — not because targeting broke, but because your creative supply ran out.
How Many Video Ads Do You Actually Need?
The answer depends on your monthly ad budget, your target audience size, and your campaign objectives. Here's the framework by budget tier:
Creative Volume by Budget Level
| Monthly Budget | Minimum Creatives | Recommended Creatives | Optimal Creatives |
|---|---|---|---|
| $500–$1,500 | 20 | 50 | 100 |
| $1,500–$5,000 | 50 | 100 | 200 |
| $5,000–$15,000 | 100 | 200 | 300+ |
| $15,000–$50,000 | 200 | 300 | 500+ |
| $50,000+ | 300 | 500 | 1,000+ |
Why These Numbers?
The minimum threshold comes from platform optimization mechanics. Meta, TikTok, and Google all require approximately 50 optimization events per ad set per week to fully exit the learning phase and deliver stable results. Below that threshold, the algorithm is guessing.
At a $1,500/month budget with a $50 CPL, you're generating roughly 30 leads per month across your entire campaign. Split that across 5 creatives, each individual creative gets 6 optimization signals per month — a statistically meaningless sample. Split across 50 creatives in a Dynamic Creative Optimization setup, the algorithm pools events and can identify winning elements within 2–3 weeks.
The recommended number factors in creative rotation cadence. If you want to introduce fresh creative every week (which you should), you need a large enough library that you're not recycling tired ads while you produce new ones. A 100-creative library with weekly rotation of 20 active ads gives you 5 weeks of coverage — enough buffer to run continuous production cycles without gaps.
The optimal number is where you stop wondering what might work and start knowing. At 300+ creatives, you've tested enough hooks, formats, angles, and CTAs to have a genuine map of your buyer's psychology. That map is worth more than any single campaign.
Creative Volume vs. CPL: Real Campaign Data
Based on campaign performance data across home services, real estate, mortgage, and professional services verticals:
| Creative Volume | Average CPL (Month 1) | Average CPL (Month 3) | CPL Reduction |
|---|---|---|---|
| 1–5 ads | $78 | $94 | −17% (worsened) |
| 6–15 ads | $65 | $71 | −8% (slight worsening) |
| 16–50 ads | $58 | $41 | +29% improvement |
| 51–150 ads | $52 | $31 | +40% improvement |
| 151–300 ads | $49 | $24 | +51% improvement |
| 300+ ads | $44 | $19 | +57% improvement |
The pattern is consistent: below 15 creatives, campaigns deteriorate over time. Above 50 creatives, they improve — because you're generating enough signal to optimize toward winners and enough fresh supply to prevent frequency buildup.
Creative Testing Framework: A/B, Multivariate, and Champion-Challenger
There are three testing methodologies worth understanding. Each has a specific use case, and elite advertisers use all three in sequence.
A/B Testing: The Baseline
What it is: Split your audience randomly into two equal groups. Show Group A creative version 1. Show Group B creative version 2. Measure which performs better.
When to use it: Validating a single variable — hook vs. hook, CTA vs. CTA, format vs. format. Best for early-stage testing when you're trying to establish which category of approach works at all.
Minimum budget required: $200–$500 per ad variant to reach statistical significance, assuming a $30–$80 CPL. Less than that and you're reading noise.
Limitation: Can only test one variable at a time. Testing 10 hooks via straight A/B takes 10x the budget and time of multivariate testing.
| A/B Test Variable | What to Measure | Minimum Events Needed |
|---|---|---|
| Hook (first 3 seconds) | Video retention rate + CTR | 500 impressions per variant |
| Offer (what you're promising) | Conversion rate + CPL | 30 leads per variant |
| CTA language | Click-through rate | 200 clicks per variant |
| Video length (15s vs 30s vs 60s) | Completion rate + CPL | 1,000 impressions per variant |
| Format (talking head vs text-on-screen) | Thumb-stop rate + CTR | 500 impressions per variant |
Multivariate Testing: Speed at Scale
What it is: Test multiple variables simultaneously using Dynamic Creative Optimization (DCO) on Meta or similar features on other platforms. You provide 5 hooks, 3 body options, and 4 CTAs — the platform mixes and matches to find the best-performing combination.
When to use it: When you have a large enough creative library (50+ assets) and sufficient budget ($3,000+/month) to generate signal across combinations. DCO needs volume to work.
The advantage: You can test 60 creative combinations in the time and budget it would take to A/B test 4 pairs. The algorithm does the combinatorial optimization for you.
The limitation: You lose some control over which specific combination is being tested at any moment. DCO is best for optimization, not controlled scientific experiments.
Meta DCO Setup:
| Asset Type | Recommended Quantity | Max Allowed |
|---|---|---|
| Video hooks | 5–10 | 10 |
| Primary text variations | 3–5 | 5 |
| Headlines | 3–5 | 5 |
| Descriptions | 2–3 | 5 |
| CTAs | 2–3 | 5 |
At maximum settings, that's 10 × 5 × 5 × 5 × 5 = 6,250 possible combinations. Meta's algorithm explores this space and surfaces winners automatically.
Champion-Challenger: The Ongoing System
What it is: You maintain a "champion" — your current best-performing creative — and continuously pit "challengers" against it. When a challenger beats the champion by a statistically significant margin, it becomes the new champion.
When to use it: This is your permanent operating methodology once you have campaign data. It's not a test you run once — it's the ongoing system that prevents performance decay and continuously improves results.
The cadence:
- Week 1–2: Champion runs at 70% of budget. 3 challengers split 30%.
- Week 3: Evaluate. If a challenger beats champion by 15%+ on CPL, promote it.
- Week 4: New champion runs at 70%. Introduce 3 new challengers.
- Repeat indefinitely.
Why champion-challenger beats "test everything equally":
Allocating equal budget to proven winners and unproven experiments wastes spend on underperformers. Champion-challenger protects your results while systematically seeking improvement. It's how hedge funds manage trading strategies — never abandon what's working, but always be looking for something better.
| Methodology | Best For | Budget Threshold | Learning Speed |
|---|---|---|---|
| A/B Testing | Validating single variables | $500/month minimum | Slow — one variable at a time |
| Multivariate / DCO | Optimizing across combinations | $3,000/month minimum | Fast — simultaneous combination testing |
| Champion-Challenger | Ongoing campaign management | Any budget | Continuous — never stops |
Ad Fatigue Data: Performance by Day
This is the curve everyone needs to understand. Ad performance doesn't decay linearly — it follows a specific pattern depending on audience size, budget, and creative volume.
Performance Decay Table: Single Creative, Cold Audience, $50/day Budget
| Day | Avg CTR | Avg Frequency | Avg CPL | Thumb-Stop Rate | Relative Performance |
|---|---|---|---|---|---|
| 1 | 3.8% | 1.1 | $28 | 34% | 100% (baseline) |
| 3 | 3.4% | 1.6 | $31 | 31% | 92% |
| 7 | 2.1% | 2.8 | $49 | 24% | 71% |
| 14 | 1.2% | 4.2 | $84 | 17% | 49% |
| 21 | 0.7% | 5.8 | $143 | 11% | 32% |
| 30 | 0.4% | 7.1 | $218 | 7% | 18% |
The drop-off between Day 7 and Day 14 is where most advertisers first notice something is wrong. By Day 14, CPL has nearly tripled. By Day 21, it's 5x the launch CPL. By Day 30, you're at 8x — and most advertisers who haven't rotated creative by this point have either burned through their budget or scaled back spend out of frustration.
What Happens With Creative Rotation
The same campaign, same audience, same budget — but with fresh creative introduced every 7 days:
| Day | Avg CTR | Avg Frequency | Avg CPL | Creative Age | Relative Performance |
|---|---|---|---|---|---|
| 1 | 3.8% | 1.1 | $28 | New | 100% |
| 7 | 2.1% | 2.8 | $49 | 7 days | 71% |
| 8 (new creative) | 3.6% | 1.2 | $30 | New | 97% |
| 14 | 2.2% | 2.6 | $48 | 7 days | 70% |
| 15 (new creative) | 3.5% | 1.1 | $31 | New | 95% |
| 30 | 2.3% | 2.5 | $46 | 7 days | 70% |
Creative rotation keeps your campaign running at 70–97% of peak performance indefinitely. The same campaign without rotation deteriorates to 18% of peak performance by Day 30.
This is why creative volume is the single biggest ROAS lever available to most advertisers.
The Creative Half-Life Varies by Platform
| Platform | Avg Creative Half-Life (Cold Audience) | Avg Creative Half-Life (Warm Audience) |
|---|---|---|
| Meta (Facebook/Instagram) | 6–9 days | 12–18 days |
| TikTok | 3–7 days | 8–14 days |
| YouTube (in-stream) | 14–21 days | 21–30 days |
| YouTube (Shorts) | 5–8 days | 10–15 days |
| 21–35 days | 30–45 days | |
| 14–28 days | 28–45 days |
TikTok burns through creative the fastest — its recommendation algorithm reaches your best-fit audience very quickly, meaning frequency builds rapidly. LinkedIn has the longest creative lifespan because B2B audiences are smaller and platform visit frequency is lower. YouTube's longer lifespan exists because users are in "content consumption" mode and more tolerant of repeated exposure to pre-roll formats.
Testing Metrics to Track
Knowing what to measure is as important as knowing what to test. Most advertisers track the obvious metrics and miss the signals that predict future performance.
Tier 1: Primary Campaign Metrics
These are the outcomes that determine whether the campaign is working:
| Metric | Definition | Benchmark (Home Services) | Benchmark (Real Estate) | Benchmark (Mortgage) |
|---|---|---|---|---|
| Cost per Lead (CPL) | Total spend ÷ leads generated | $15–$65 | $25–$90 | $35–$120 |
| Cost per Appointment (CPA) | Total spend ÷ appointments booked | $45–$180 | $75–$250 | $90–$350 |
| Cost per Acquisition (CPA) | Total spend ÷ closed deals | $150–$600 | $250–$1,200 | $400–$2,000 |
| Return on Ad Spend (ROAS) | Revenue generated ÷ ad spend | 3:1–8:1 | 4:1–12:1 | 5:1–20:1 |
| Lead-to-Appointment Rate | Appointments ÷ leads | 25%–45% | 20%–40% | 20%–35% |
Tier 2: Creative Engagement Metrics
These predict whether primary metrics will improve or deteriorate before the trend fully shows up in CPL:
| Metric | Definition | What It Tells You | Warning Threshold |
|---|---|---|---|
| Thumb-Stop Rate | 3-second video views ÷ impressions | Whether the hook works | Below 25% |
| Video Completion Rate | Full video views ÷ 3-second views | Whether the body holds attention | Below 20% |
| Click-Through Rate (CTR) | Link clicks ÷ impressions | Whether the CTA is compelling | Below 1.0% |
| Hook Retention (0–3s) | % watching past 3 seconds | Scroll-stopping power | Below 30% |
| Hook Retention (0–15s) | % watching past 15 seconds | Story engagement | Below 15% |
| Outbound CTR | Outbound clicks ÷ impressions | Purchase intent signal | Below 0.8% |
The most underused metric: Thumb-Stop Rate. If your thumb-stop rate drops below 25%, no amount of targeting optimization will save the campaign. The hook isn't working. Fix the hook before adjusting anything else.
Tier 3: Audience Quality Indicators
These help you distinguish between campaigns generating leads and campaigns generating the right leads:
- Lead-to-appointment show rate: What percentage of leads actually attend a scheduled call or appointment?
- Appointment-to-close rate: What percentage of appointments convert to clients?
- Average deal size from campaign leads: Are your leads skewing toward high-value or low-value jobs?
- Days to close: Campaign leads that close in under 14 days are typically higher quality than those requiring 60+ days of nurture.
If your CPL looks great but lead quality is poor, the creative is attracting the wrong person. This usually means the hook is too broad or too urgency-focused. Tighten the specificity.
The Optimization Process: Week-by-Week
Here's the operating cadence that separates systematically improving advertisers from ones who "just let it run."
Week 1–2: Launch and Listen
Goals: Generate initial signal. Do not make significant changes.
- Launch 20–50 creatives across 3–5 ad sets with broad targeting
- Set a minimum budget per ad set that allows for daily optimization events (rule of thumb: $30–$50 per ad set per day minimum)
- Do not pause underperformers before Day 7 — early data is unreliable
- Track: Thumb-stop rate, 3-second video views, initial CTR
The biggest mistake in Week 1: Turning off ads that "look bad" after 24–48 hours. You need 500–1,000 impressions per creative before CTR data is meaningful. Frequency is low, sample size is small, and early performance rarely predicts sustained performance accurately.
Week 3–4: First Optimization Round
Goals: Identify the top 20% of creatives. Kill the bottom 30%. Introduce new challengers.
- Pause any creative with less than 0.8% CTR and under 25% thumb-stop rate (after 1,000+ impressions)
- Identify top performers by CPL if you have enough conversion data
- Double the budget allocation to the top 3–5 creatives
- Introduce 10–15 new challengers testing new hooks or angles suggested by early winners
What "winning" looks like at this stage:
- CPL within 30% of your target
- CTR above 1.5%
- Thumb-stop rate above 30%
- Video completion above 25%
Week 5–8: Scale and Diversify
Goals: Scale winning angles. Test format and length variations of winners.
- Take your top 3 performing hooks and create 5 variations of each (different length, different format, different opening line but same hook idea)
- Increase spend on ad sets containing proven creative
- Test platform-specific formats (Reels vs. Feed vs. Stories on Meta; In-Feed vs. TopView vs. Branded on TikTok)
- Begin champion-challenger methodology formally
Week 9–12: Systematize
Goals: Build the repeatable production and testing cycle.
- Establish a weekly creative production cadence (aim for 10–20 new creatives per week)
- Set up automated rules to pause ads when frequency hits 3.5+
- Create a "proven hooks" library from your top performers — these become the baseline for future production cycles
- Begin testing audience-specific creative variations (different hooks for different age brackets, geographic areas, or intent signals)
Optimization Decision Tree
Is CPL within target range?
├── YES → Is frequency below 3.0?
│   ├── YES → Scale budget 20–30%
│   └── NO → Rotate in fresh creative, hold budget
└── NO → Is thumb-stop rate above 25%?
    ├── YES → Problem is landing page or offer — fix conversion path
    └── NO → Problem is creative hook — test new hooks urgently
Platform-Specific Creative Testing Strategies
The same creative does not perform equally across platforms. Audiences, formats, and algorithm incentives differ enough that platform-specific strategy is non-negotiable at serious spend levels.
Meta (Facebook + Instagram)
The Meta algorithm rewards:
- High thumb-stop rate in the first 1.5 seconds
- Hook-body-CTA structure that mirrors organic content patterns
- Format diversity (square for Feed, vertical for Reels and Stories, horizontal for right-rail)
Testing priorities on Meta:
| Test Type | Variables to Test | Budget Allocation |
|---|---|---|
| Hook testing | 8–12 different openers | 40% of testing budget |
| Format testing | Square vs. vertical vs. horizontal | 20% of testing budget |
| Offer testing | Different lead magnets / CTAs | 25% of testing budget |
| Length testing | 15s vs. 30s vs. 60s | 15% of testing budget |
Meta-specific insight: Advantage+ Creative now automatically adjusts your creative for different placements — but only if you give it sufficient variety. Upload multiple aspect ratios and text variations for best results.
Recommended creative rotation cadence on Meta: Introduce 10 new creatives per week at steady-state. Pause any creative reaching frequency 3.5+ in your target audience. Maintain a library of 30–50 "active" creatives at any time.
TikTok
The TikTok algorithm rewards:
- Native authenticity — ads that look like organic TikTok content dramatically outperform polished commercial-style ads
- Sound-on viewing — 90%+ of TikTok viewers watch with sound, opposite of Meta where 85%+ watch sound-off
- First-frame hook that triggers the "what is this?" reflex
- Trending audio and format conventions
Testing priorities on TikTok:
| Test Type | Variables to Test | Notes |
|---|---|---|
| Hook style | Native vs. polished vs. text-first | Native typically wins by 2–4x |
| Audio | Original audio vs. trending sounds | Test trending audio overlays |
| Creator style | On-camera vs. voiceover vs. text-overlay | Depends on vertical |
| Length | 7s vs. 15s vs. 30s vs. 60s | Shorter often wins for cold traffic |
| Caption strategy | Story-forward vs. CTA-forward | Test both |
TikTok-specific insight: The platform's creative fatigue is the fastest of any major platform. TikTok's algorithm surfaces your best content to your best-fit audience within 24–72 hours — which means frequency builds rapidly. Plan for weekly creative refreshes at minimum, twice-weekly if spending $5,000+/month.
The "Golden Hour" on TikTok: New creatives get an algorithmic "boost" in the first 24 hours. Monitor performance in this window aggressively — a strong early signal predicts sustained performance better than on Meta.
YouTube
YouTube's algorithm rewards:
- Holding attention past the skip point (5 seconds for in-stream, 3 seconds for Shorts)
- Delivering genuine value in the first 30 seconds before asking for anything
- Longer content for warm audiences (2–10 minute brand videos convert warm traffic at premium rates)
- Shorts for cold prospecting, long-form for retargeting
Testing priorities on YouTube:
| Ad Format | Best Use | Recommended Length | Testing Priority |
|---|---|---|---|
| In-stream (skippable) | Cold audience prospecting | 30–90 seconds | Hook variety (first 5s) |
| In-stream (non-skippable) | Brand awareness | 15–20 seconds | Message clarity |
| YouTube Shorts | Cold mobile prospecting | 7–30 seconds | Native-style hooks |
| Discovery ads | Warm audience retargeting | 2–10 minutes | Value-first content |
| Bumper ads | Frequency capping / retargeting | 6 seconds | Single core message |
YouTube-specific insight: YouTube's creative lifespan is 2–3x longer than Meta or TikTok. A single strong performing in-stream ad can run for 3–6 weeks before significant fatigue. This means you need fewer total creatives on YouTube, but each creative needs to be stronger. Invest more per creative on YouTube, run less volume.
Platform Creative Strategy Comparison
| Factor | Meta | TikTok | YouTube |
|---|---|---|---|
| Creative half-life | 7–10 days | 3–7 days | 14–21 days |
| Optimal creative volume | High (50+) | Very high (100+) | Moderate (20–30) |
| Ideal creative style | Hook-driven, polished-native | Raw, native, authentic | Value-driven, longer form |
| Sound strategy | Sound-off safe | Sound-on critical | Sound-on preferred |
| Best testing cadence | Weekly rotation | 2x/week rotation | Bi-weekly rotation |
| Primary testing metric | Thumb-stop + CPL | Hook completion + engagement | View-through rate + CPL |
Common Creative Testing Mistakes
Mistake 1: Testing Without Enough Budget Per Creative
Running 20 ads at $500/month means each ad gets $25/month — roughly 300–600 impressions at typical CPMs. You cannot make statistically valid decisions from 300 impressions. Either reduce the number of concurrent tests or increase the budget allocation per test.
The fix: Run fewer ads with adequate budget per test, then expand once you have signal. $500/month: test 5–10 ads. $1,500/month: test 15–25 ads. $5,000/month: test 50–75 ads.
Mistake 2: Stopping Tests Too Early
The "looks bad after 3 days" kill strategy destroys more potentially winning creatives than any algorithm change. Video ads frequently have a delayed response curve — the algorithm may be serving them to early responders while still learning who the best audience segment is.
The fix: No creative decisions before 1,000 impressions. No CPL-based decisions before 20 optimization events. Set a minimum impression threshold in your decision rules and enforce it.
Mistake 3: Changing Multiple Variables at Once
You run a new creative with a new hook, new CTA, new offer, and new visual style. It performs better. What worked? You have no idea. The next test is equally uninformative because you're still changing everything simultaneously.
The fix: When testing to learn (not just to optimize), change one variable per test. When testing to optimize, use DCO to let the algorithm isolate winners.
Mistake 4: Ignoring the Funnel Below the Click
Creative testing that only measures CTR will lead you to sensational, clickbait-style ads that generate clicks but poor leads. The best-performing creative in your ad account is the one that generates the lowest CPL — not the highest CTR.
The fix: Always connect creative performance data to downstream conversion data. If a creative generates 3x the CTR but 0.5x the lead quality, it's a loser, not a winner.
Mistake 5: Testing Concepts, Not Hooks
Most advertisers think they're testing different "ad concepts" when they're actually testing slightly different versions of the same concept. Five variations of "call us for a free estimate" are not five unique tests — they're one concept with minor wording changes.
The fix: Structure your testing matrix around meaningfully different buyer motivations, not surface-level copy variations. Each test should represent a different answer to "why would someone click this ad right now?"
Mistake 6: Treating Testing as an Event, Not a System
"We tested 20 ads last quarter and found our winners. Now we're running those." This is the most expensive mistake on this list. Your winners from Q1 will be fatigued by Q2. Your market will shift. Competitors will enter. Your "proven" creative becomes everyone else's "also-ran."
The fix: Allocate a permanent budget line to creative testing — 15–25% of total ad spend. Treat creative production as infrastructure, not a project. Never stop testing.
Frequently Asked Questions
How long should I run a video ad before deciding if it's working?
Minimum seven days and 1,000 impressions before making any decisions based on engagement metrics (CTR, thumb-stop). Minimum 20 lead events before making CPL-based decisions. If your budget is under $1,000/month, you may need 2–3 weeks to accumulate sufficient data on any single creative. The urge to pull underperformers in the first 48–72 hours is understandable but almost always counterproductive — early data is heavily influenced by algorithm exploration behavior, not actual audience response.
What's the difference between creative testing and campaign optimization?
Creative testing is a learning process designed to discover which messages, hooks, formats, and angles resonate with your audience. The goal is insight, and decisions are made based on statistical significance. Campaign optimization is the ongoing process of allocating budget toward proven winners and scaling what works. Both are necessary, but confusing them leads to problems: optimization decisions made without adequate testing data are just guessing, and testing budgets allocated to proven winners are wasted.
Should I test the same creatives on Meta and TikTok?
Start with the same core message, but produce platform-native executions rather than running identical videos on both. Meta audiences tolerate slightly more polished production and perform well with sound-off viewing (text overlays, captions). TikTok audiences respond dramatically better to raw, authentic, organic-feeling content with sound on. A video produced for Meta with branded bumpers and polished graphics will typically underperform on TikTok by 40–70% versus a native-style recreation of the same message. Budget permitting, produce platform-specific versions of your winning hooks.
What's a thumb-stop rate, and is mine good or bad?
Thumb-stop rate measures what percentage of people who see your ad watch at least 3 seconds of video. It's the most direct measure of whether your hook — the first 1–3 seconds — is compelling enough to interrupt the scroll. Industry benchmarks: below 20% is poor (hook isn't stopping the scroll), 20–30% is average, 30–40% is good, 40%+ is exceptional. If your thumb-stop rate is strong but CTR is low, your hook is working but your offer or CTA isn't compelling. If your thumb-stop rate is poor, fix the hook before testing anything else.
How do I know when it's time to refresh creative?
Watch for three signals: (1) Frequency exceeds 3.0 in your target audience — this is the most reliable leading indicator of performance degradation. (2) CTR drops more than 30% from the creative's best 7-day period — this signals audience fatigue specifically with this creative, not a campaign-level issue. (3) CPL increases more than 25% over a 5-day rolling average — by this point you're already in fatigue and should have acted on signals 1 or 2. Set up automated rules in your ad account to alert you when frequency hits 2.5 so you have time to introduce new creative before fatigue sets in.
How much should I budget for creative production versus media spend?
The rule of thumb at agency level is 15–25% of total ad spend allocated to creative production. At a $3,000/month media budget, that's $450–$750/month in creative production costs. With traditional production (agency or freelancer), $450/month buys 1–2 videos at best — which is why most small advertisers chronically under-test. With batch video production, $450–$750/month can fund 50–100 new creatives per month, enabling the testing volume that actually moves the needle. The math on traditional production makes adequate creative testing financially impossible for most advertisers. Batch production makes it the cheapest line item in the budget.
What does a "winning" creative actually look like in the data?
A winning creative shows a consistent pattern across multiple metrics, not just one standout number. Look for: CPL at or below target for 10+ consecutive days, CTR above 1.5%, thumb-stop rate above 30%, video completion rate above 25%, and lead quality metrics (appointment show rate, close rate) at or above campaign average. A creative with a 3% CTR but poor lead quality isn't a winner — it's attracting the wrong people. True winners perform across the full funnel from impression through close.
How do I avoid testing the same ideas repeatedly?
Build a structured creative matrix. Start with your buyer's primary objections and hesitations — these are the raw material for hook diversity. For each objection, develop 3–5 unique ways to address it (question hook, statement hook, story hook, statistic hook, authority hook). Cross these with format variations (talking head, text-on-screen, B-roll with voiceover, split-screen). The matrix approach guarantees variety and prevents the unconscious tendency to test slight wording changes and call them different concepts. Review your test history quarterly to identify which objection categories you've under-tested.
Can I repurpose organic content as ad creative?
Yes, and you should — this is one of the highest-ROI moves available to most advertisers. Organic content that performed well on your own channels (views, shares, comments) has already validated that the hook and format resonate with people who voluntarily consumed it. Running done-for-you social media at high volume gives you a constant pipeline of organic performance data to source pre-validated hooks from — your paid creative pipeline and your organic content engine feed each other. When you boost or whitelist organic content, you're spending media dollars on pre-validated creative rather than unproven material. The catch: organic performance doesn't perfectly predict paid performance, because organic reach skews toward your existing audience and warm followers while paid cold traffic is different. Treat organic-to-paid repurposing as a strong starting point, not a definitive signal.
How does creative testing change as I scale spend?
At low spend ($500–$1,500/month), creative testing is primarily about identifying which broad approach (which problem/solution angle) resonates at all. Testing is sequential because budget limits parallel tests. At mid-spend ($5,000–$15,000/month), creative testing shifts to simultaneous parallel testing using DCO, and you start optimizing within proven angle categories. At high spend ($25,000+/month), creative testing becomes a continuous industrial process — the question is never "what should we test?" but "how quickly can we produce enough creative volume to feed the algorithm?" At this spend level, creative production velocity is the binding constraint on growth, not budget or targeting. The same volume principle applies to organic presence: brands publishing 1,000+ posts per month create the consistent visibility that makes every paid creative land warmer.
Related Reading
- Batch Video Ads: The Complete Guide to Creative Volume at Scale (2026) — How to produce 300+ video ads without a large production team or budget, and the batch production methodology behind the fastest-growing ad creative operations.
- Ad Fatigue: Why Your Ads Stop Working After 7 Days (And How to Fix It) — A deep dive into the mechanics of creative fatigue, including frequency data by platform, audience size, and spend level, with the tactical playbook for prevention and recovery.
- How Many Facebook Ads Do You Actually Need? (2026 Data) — Platform-specific analysis of the minimum creative volume needed to generate sustained results on Meta, with budget-tiered recommendations and real campaign data.
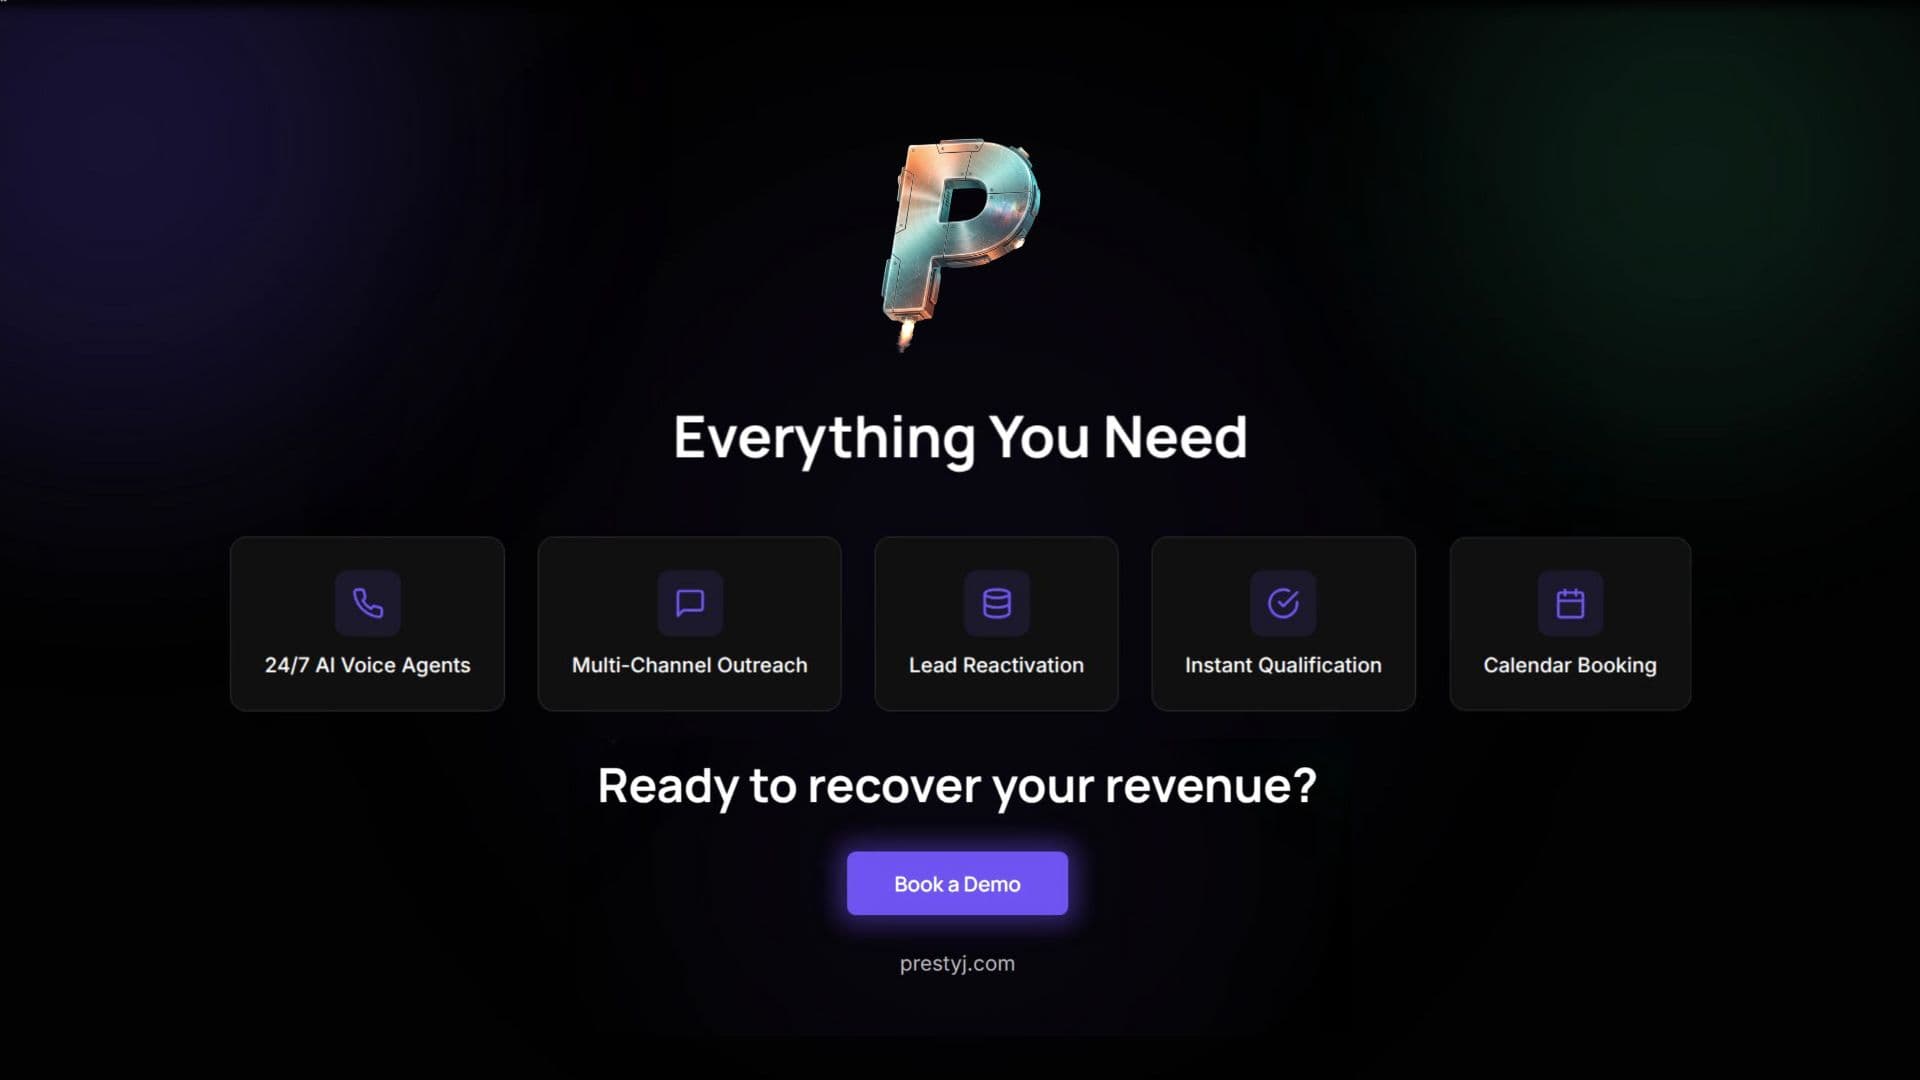
Ready to Fix Your Creative Testing Volume?
Most advertisers reading this guide know they're under-testing. They've seen the fatigue curve. They understand the math. The problem isn't knowledge — it's production. Building a library of 50, 100, or 300 video ads through traditional production is a six-figure investment and a multi-month project.
Prestyj solves the production bottleneck. One 20-minute footage session becomes 300 production-ready video ad variations — cut, captioned, formatted, and organized by hook and buyer motivation — delivered in 24 hours. At $5–$50 per creative versus $500–$5,000 for traditional production, the math on proper creative testing finally works at every budget level.
Book a Demo to See How It Works →
See exactly how our batch creative process works, what a 300-ad library looks like, and how advertisers in your vertical are structuring their testing programs.
Related reading
The message that brings in new clients isn't written — it's discovered by testing dozens of angles at once. Here's the volume-first method for finding winning ad angles that make the phone ring, and what it actually costs to run.
Batch video ads vs traditional video production for lead generation in 2026: hidden costs beyond the per-video rate, real cost per ad at scale ($5–$50 AI vs $500–$5,000 traditional), and creative volume benchmarks for media buyers, agency owners, coaches, CMOs, and service businesses (HVAC, roofing, mortgage, real estate).
How many video ads you actually need at scale in 2026: cost per winning ad by budget and platform, hidden costs of running too few creatives, and data-backed volume benchmarks by vertical (coaches, agencies, HVAC, roofing, mortgage, real estate). Skeptical media buyer's and CMO's buyer's guide.